This page highlights a selection of my work in visual analytics research, where I explore how data can be transformed into intuitive, interactive, and insightful visual representations. A motivating goal of all visual analytics work is to design tools and methods that help people uncover patterns, make informed decisions, and tell compelling stories with data. The examples that follow showcase both the technical foundations and the creative problem-solving that drive my approach.
Albireo
Computational notebooks have become a major medium for data exploration and insight communication in data science. Although expressive, dynamic, and flexible, in practice they are loose collections of scripts, charts, and tables that rarely tell a story or clearly represent the analysis process. This leads to a number of usability issues, particularly in the comprehension and exploration of notebooks. In this work, we design, implement, and evaluate Albireo, a visualization approach to summarize the structure of notebooks, with the goal of supporting more effective exploration and communication by displaying the dependencies and relationships between the cells of a notebook using a dynamic graph structure. We evaluate the system via a case study and expert interviews, with our results indicating that such a visualization is useful for an analyst’s self-reflection during exploratory programming, and also effective for communication of narratives and collaboration between analysts.
Related publications:
- John Wenskovitch, Jian Zhao, Scott Carter, Matthew Cooper, and Chris North. “Albireo: An Interactive Tool for Visually Summarizing Computational Notebook Structure,” in 2019 Symposium on Visualization in Data Science. VDS’19. Vancouver, BC, Canada, Oct. 2019, pp. 1-10. DOI: 10.1109/VDS48975.2019.8973385.
Castor, Pollux, and Gemini
Castor, Pollux, and Gemini are three different implementations of a computational pipeline that projects high-dimensional data into an interactive visualization, combining both dimension reduction and clustering algorithms in the projection. In addition to DR and clustering, semantic interactions are implemented within the interface, allowing an analyst to provide feedback to an underlying learning component. With this feedback, an analyst can interact directly with the data to express their interests, incrementally training those underlying models and causing future updates to the visualization to better reflect the dimensions of interest to the analyst. The overarching goal of this research is to explore both the design and interaction space at the intersection of dimension reduction algorithms, clustering algorithms, and semantic interaction.
Related publications:
- John Wenskovitch, Michelle Dowling, and Chris North. “Towards Addressing Ambiguous Interactions and Inferring User Intent with Dimension Reduction and Clustering Combinations in Visual Analytics,” ACM Transactions on Interactive Intelligent Systems (TiiS), 14(1) (Mar. 2024). DOI: 10.1145/3588565.
- John Wenskovitch and Chris North. “Pollux: Interactive Cluster-First Projections of High-Dimensional Data,” in 2019 Symposium on Visualization in Data Science. VDS’19. Vancouver, BC, Canada, Oct. 2019, pp. 38-47. DOI: 10.1109/VDS48975.2019.8973381.
- John Wenskovitch, Ian Crandell, Naren Ramakrishnan, Leanna House, Scotland Leman, and Chris North. “Towards a Systematic Combination of Dimension Reduction and Clustering in Visual Analytics,” IEEE Transactions on Visualization and Computer Graphics, 24(1) (Jan. 2018), pp. 131–141. DOI: 10.1109/TVCG.2017.2745258. Presented at IEEE VIS (VAST) 2017.
- John Wenskovitch and Chris North. “Observation-Level Interaction with Clustering and Dimension Reduction Algorithms,” in Proceedings of the 2nd Workshop on Human-In-the-Loop Data Analytics. HILDA’17. Chicago, IL, USA: ACM, 2017, 14:1–14:6. DOI: 10.1145/3077257.3077259.
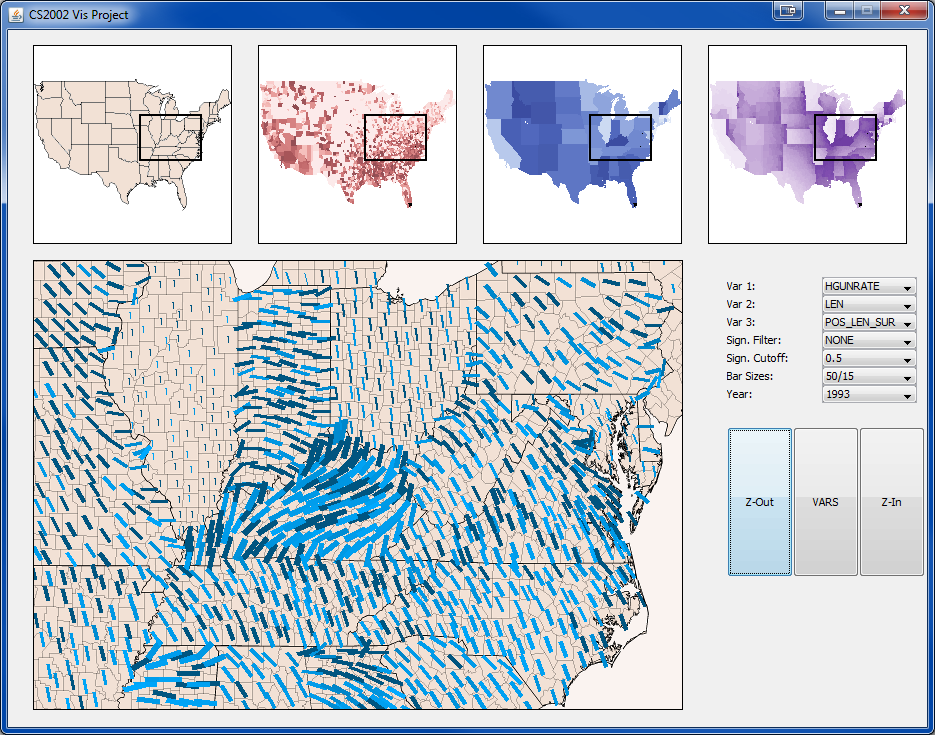
Mapping Crime and Weapon Data
Statisticians frequently utilize charts and graphs to see correlations in their data. However, multivariate datasets can present a challenge to simple visualizations, and finding geographic correlations presents further difficulties. This project was developed to visualize a multivariate dataset with a geographical component, in this case visualizing data on gun homicide rates, gun leniency laws, and the number of federally licensed firearms dealers by county. The application provides dropdown lists for dynamic querying, allowing a user to display up to 3 of 25 variables simultaneously. Results can also be filtered by their statistical significance, based on five different significance variables at 11 different levels. Multiple linked views connect a detail view with four overview maps, showing the details map’s overall location in the country, as well as heatmaps for the selected variables. Evaluations found that most users were impressed by the application, and found it more useful than the standard representations of statistical data. The learning curve for the system is the biggest obstacle, but once a user is familiar with how everything works, they saw a number of uses for the application.
Related Publications:
- Scott Rothenberger, John Wenskovitch, and G. Elisabeta Marai. “Pexel and Heatmap Visual Analysis of Multidimensional Gun/Homicide Data,” in IEEE Visualization VAST Poster Compendium. Providence, RI, 2011, pp. 297–298. DOI: 10.1109/VAST.2011.6102482.