Statisticians frequently utilize charts and graphs to see correlations in their data. However, multivariate datasets can present a challenge to simple visualizations, and finding geographic correlations presents further difficulties. This project, created by myself and Scott Rothenberger of the Department of Statistics, was developed to visualize a multivariate dataset with a geographical component, in this case visualizing data on gun homicide rates, gun leniency laws, and the number of federally licensed firearms dealers by county.
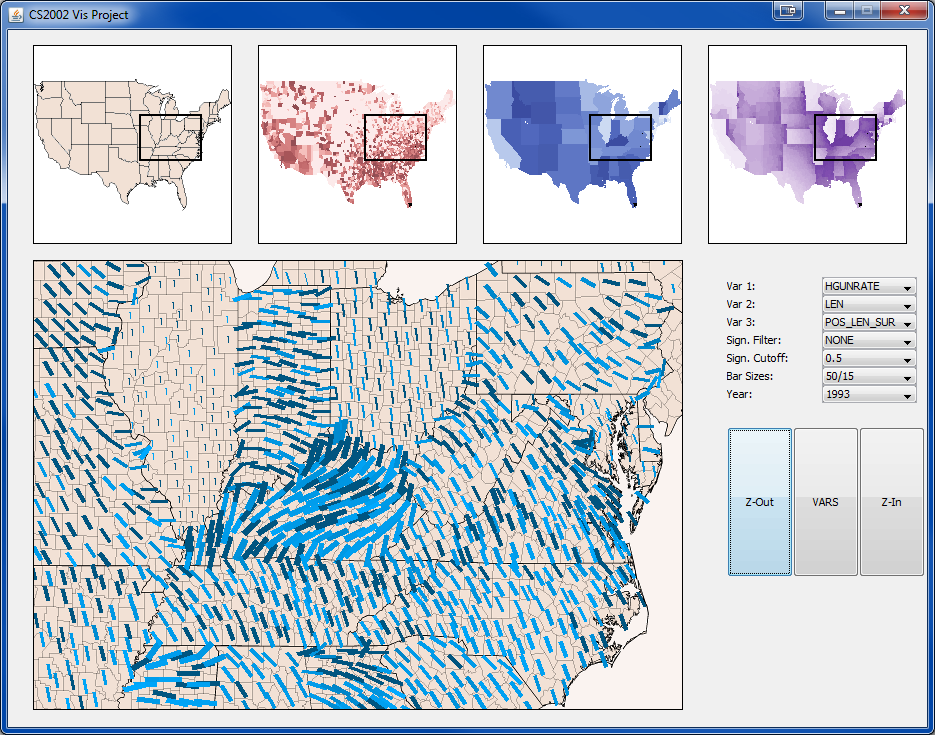
This application provides dropdown lists for a number of dynamic queries, allowing a user to display up to 3 of 25 variables simultaneously. Another dropdown allows the results to be filtered by their statistical significance, based on five different significance variables at 11 different levels. Multiple linked views connect a detail view with four overview maps, showing the details map’s overall location in the country, as well as heatmaps for the selected variables. The details view presents up to 7 variables per county in a 2D glyph – the color, size, and orientation represent the three selected variables, in addition to the year (1993-1999), space (latitude and longitude), and the statistical significance. Finally, we provided details-on-demand popups for every county, allowing detailed information to be displayed including the definite values of all 25 variables.
Evaluations found that most users were impressed by the application, and found it more useful than the standard representations of statistical data. The learning curve for the system is the biggest obstacle, but once a user is familiar with how everything works, they saw a number of uses for the application.
Related Publications:
- Scott Rothenberger, John Wenskovitch, and G. Elisabeta Marai. “Pexel and Heatmap Visual Analysis of Multidimensional Gun/Homicide Data,” in IEEE Visualization VAST Poster Compendium. Providence, RI, 2011, pp. 297–298. DOI: 10.1109/VAST.2011.6102482.